2 Degrees
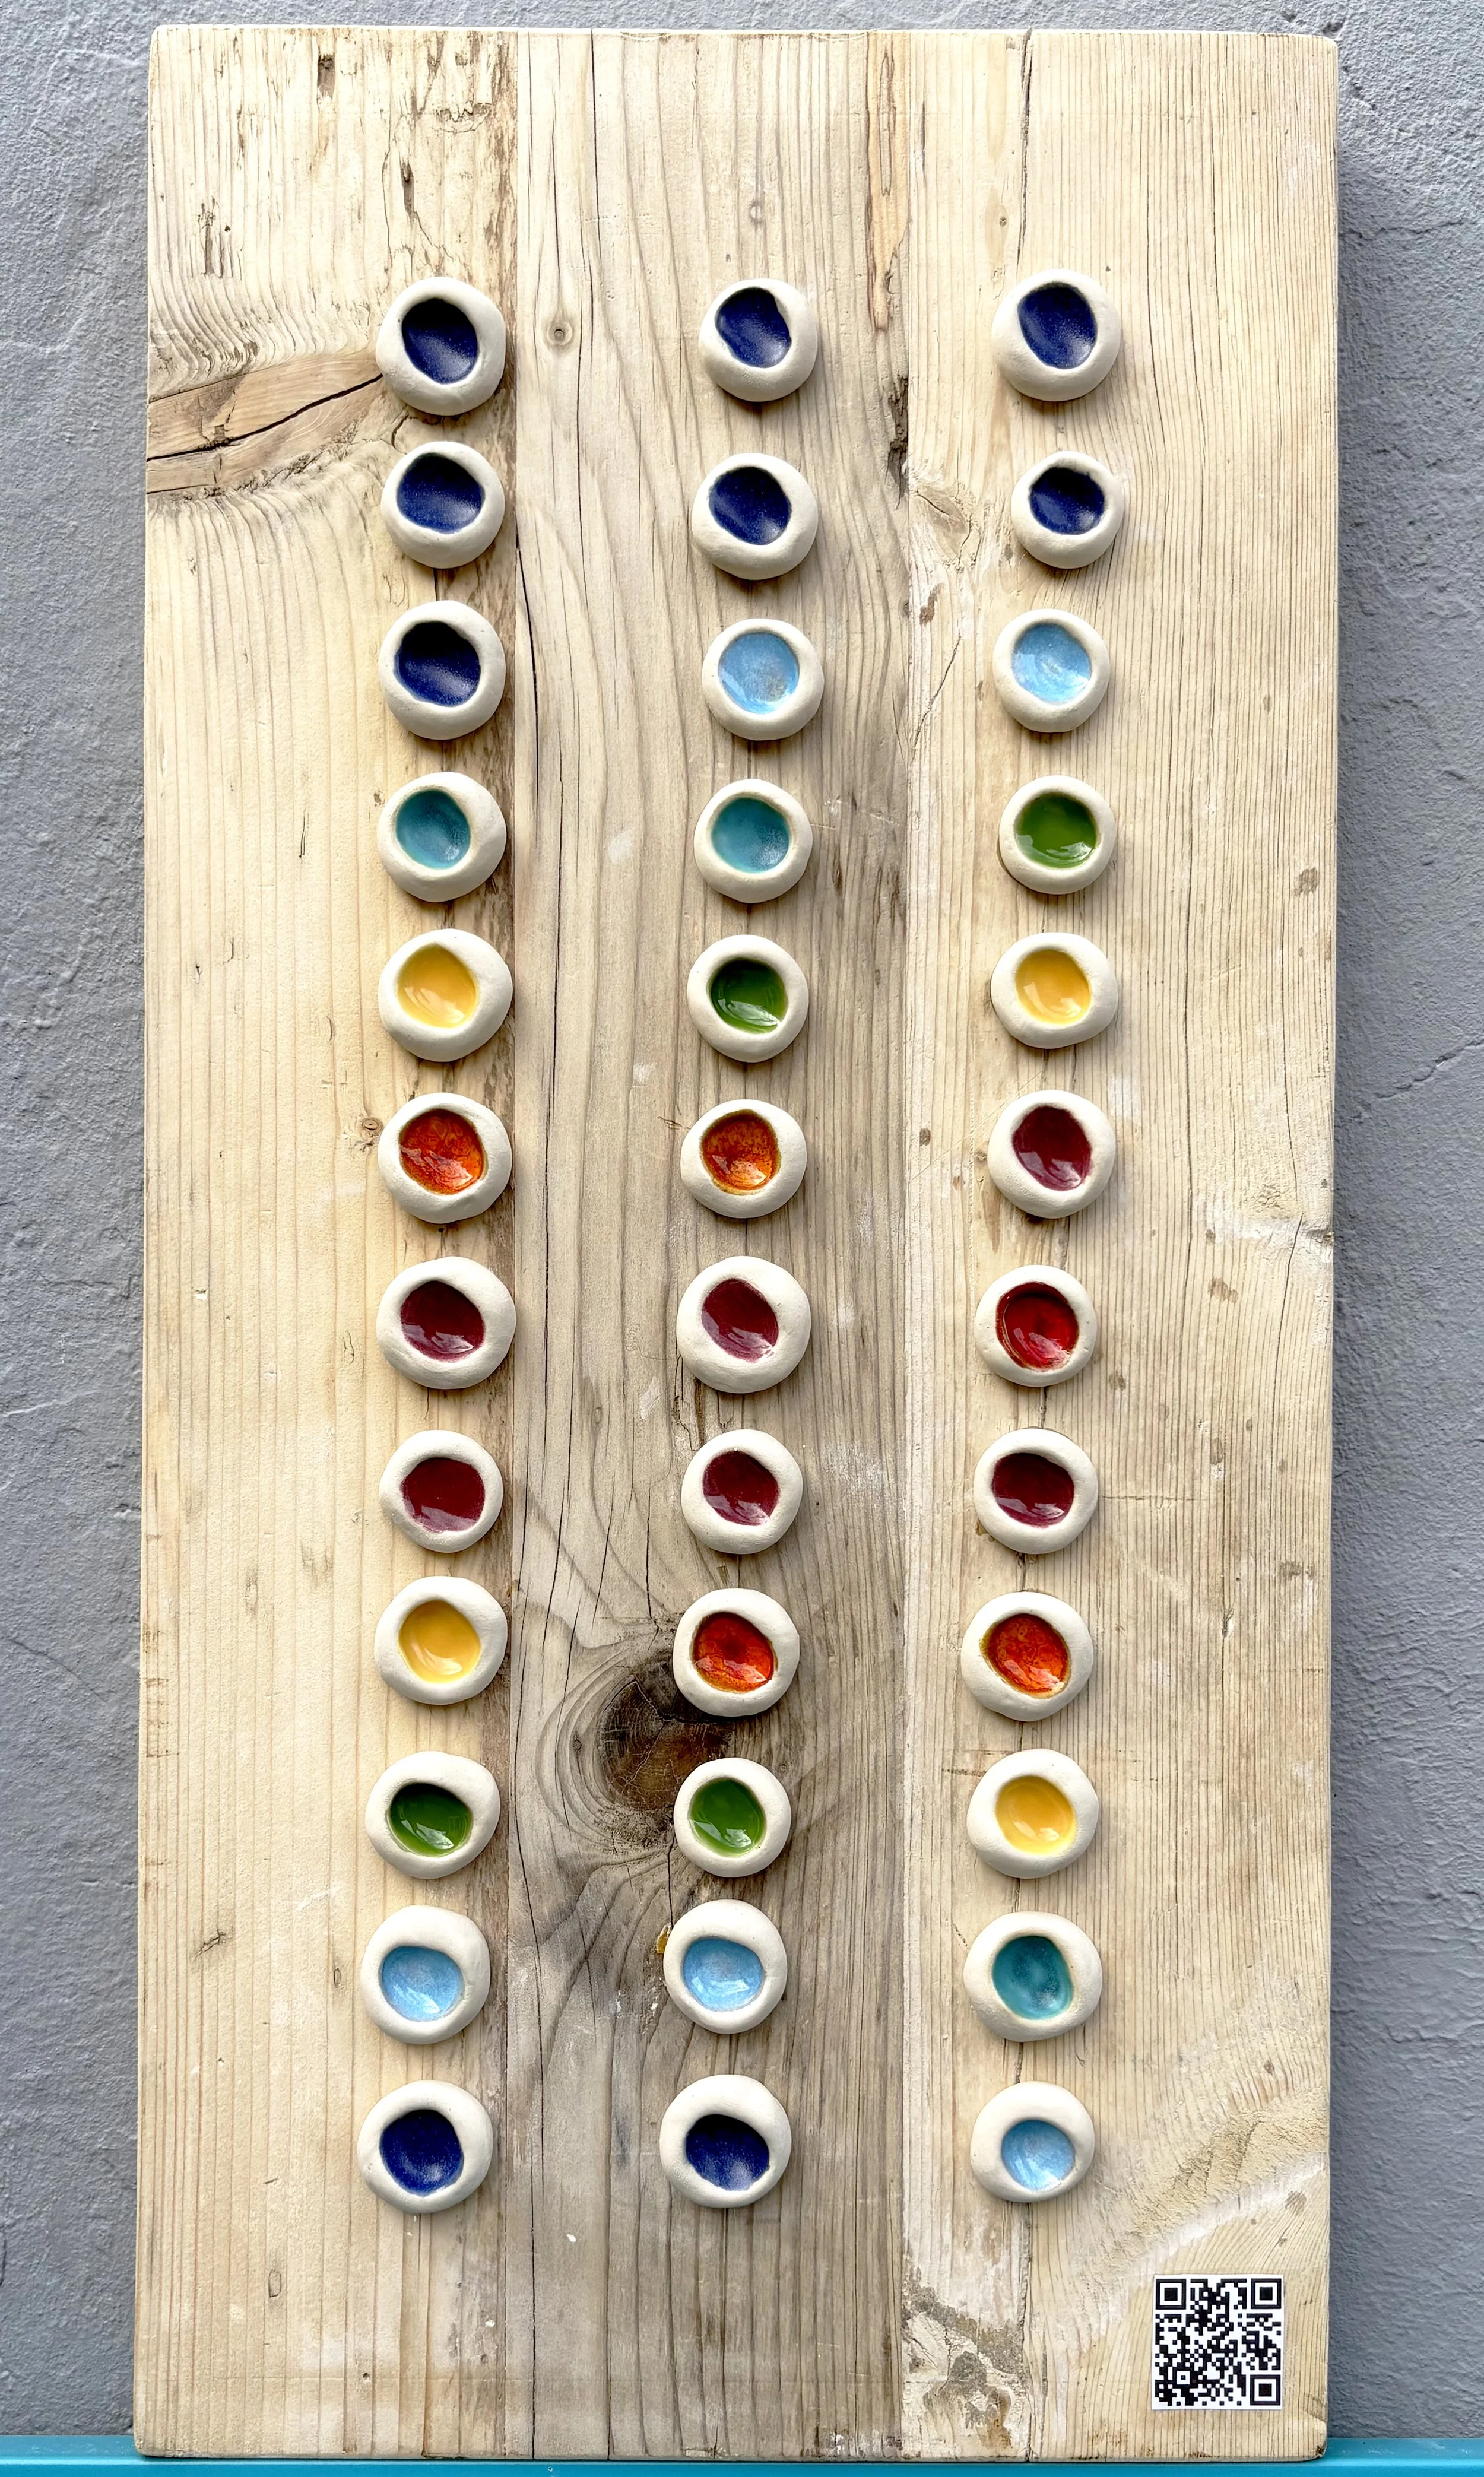
This is a mixed-media piece using ceramics and reclaimed wood from Sussex.
I’m interested in how art can provoke discussion about real world issues, and one of the paramount threats of our time is the climate crisis. As someone who lives on the Sussex coast and is aware of the impact that temperature change can have on marine life, I wanted to see if visualising the local temperature across a century would illustrate any changes and highlight the dangerous journey we’re on.
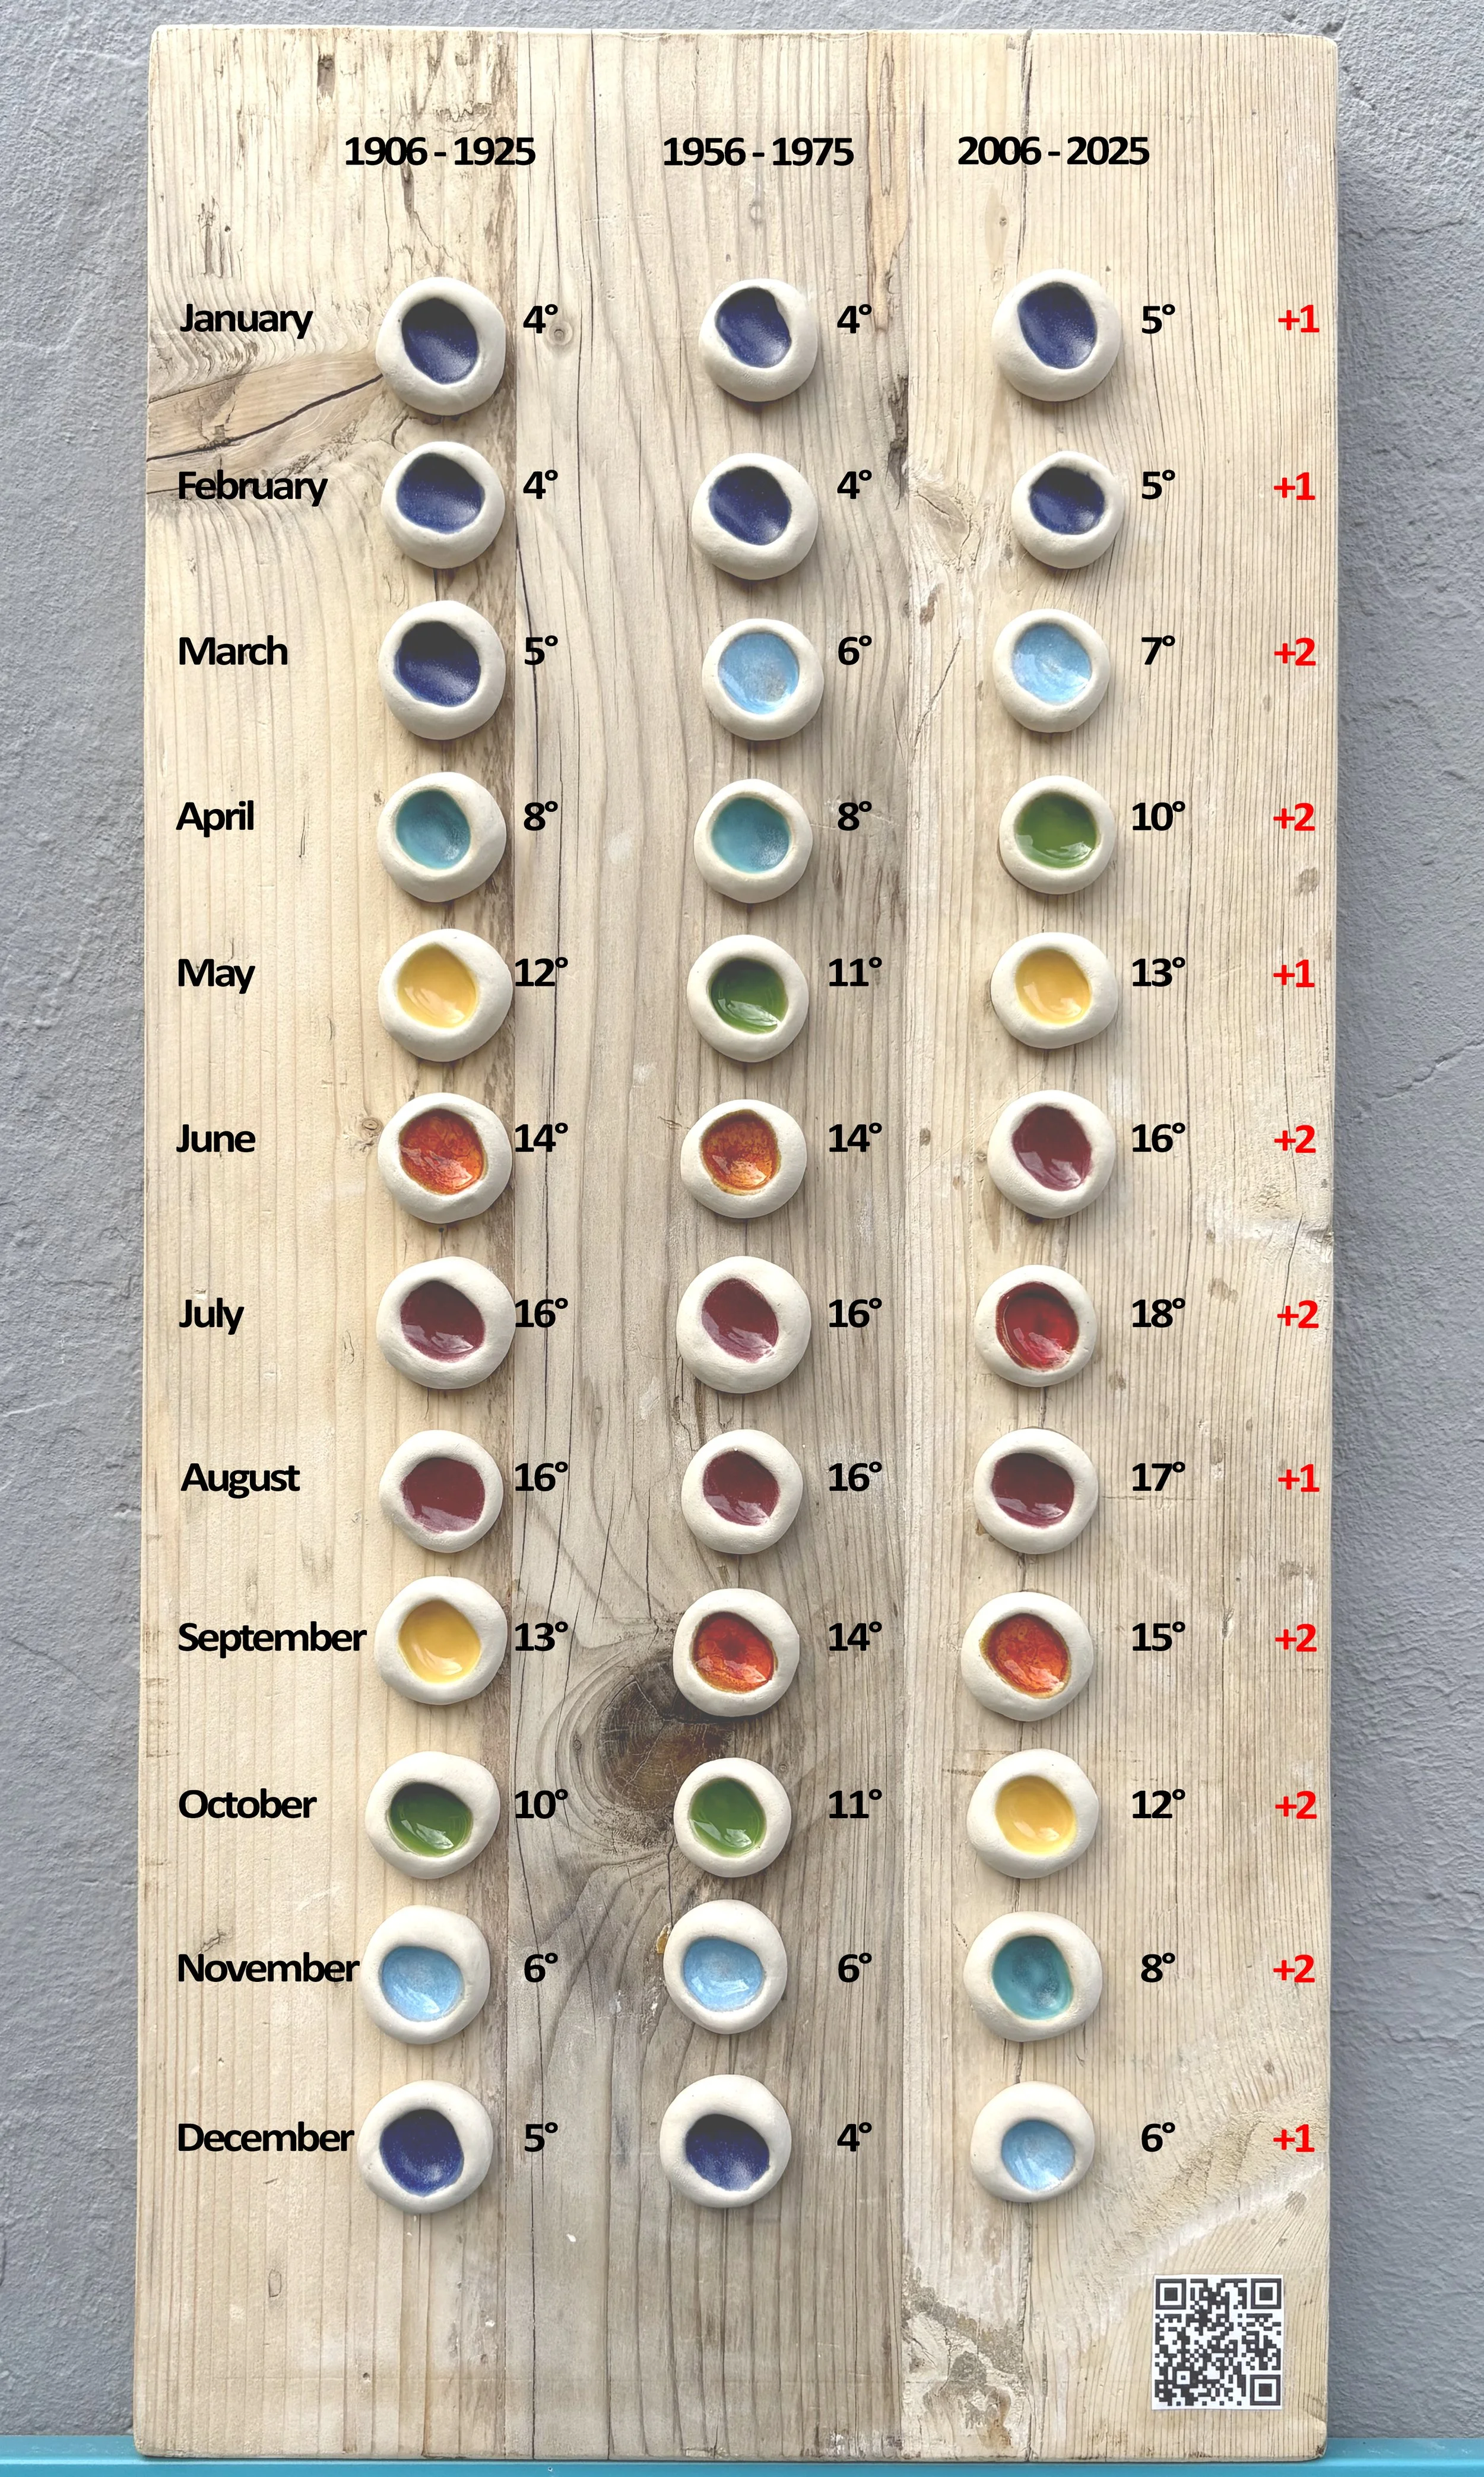
The three columns in this piece each represents a 20-year period of time (1906 – 1925; 1956 – 1975; 1996 – 2025); each row represents a month of the year; and each colour represents the average temperature in Celsius of that month (rounded to the nearest integer) for those years, with each colour corresponding to a 2°C increment. Please find an annotated photo of this piece below.
The temperature data was sourced from the UK Met Office, specifically to average temperatures in the Southeast and Central South of England.
It would be easy to cherry pick hotter or colder years that push the results in favour of specific bias, so I chose these 20-year increments to avoid an outlying year skewing the results and provide a more accurate picture of long-term trends.
Ultimately, the results show that across the last century, average temperatures in this area have increased by 1°C for 5 months of the year, and 2°C for 7 months. The climate policy of the 2016 Paris Climate Agreement is to limit global warming to less than 2°C compared to pre-industrialisation levels (1850-1900), as a 2°C increase is considered to have serious consequences for humanity and the environment.